Help
The tool for visualisation and exploration for the HD expression of UPR genes has various features, which are highlighted in the figures:
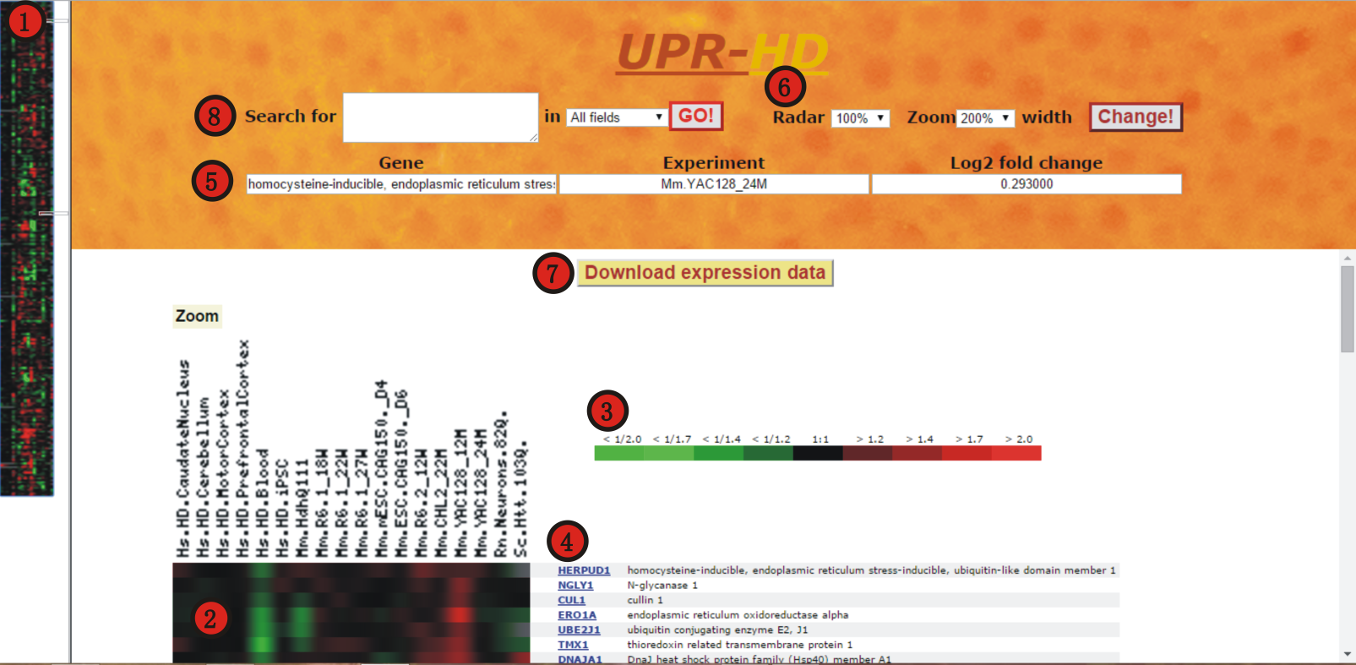
1 - Miniature heat map: By clicking on a certain region of the miniature heat map, the user selects an area which is expanded in the zoom heat map.
2 - Zoom heat map: Here the area selected in the miniature heat map is expanded. Rows represent genes associated with UPR, and columns represent different experimental HD expression studies. Expression values are colour coded according to the colour bar. For further information on experimental studies see Data & Samples section. Gene expression values that are not available for some studies are indicated by gray squares. Genes whose expression values are not available for more than half of the studies were discarded.
3 - Colour bar: The colours represent the range of expression values of UPR genes in the heat maps. Red and green code for higher and lower expression values respectively compared to the reference sample. Black codes for no expression differences. Gray represents missing values. Numbers above the colour bar are expression values in log2 fold-change.
4 - Gene description: By clicking on the gene symbol the user is re-directed to the GeneCards page of the gene, with a full description of the selected gene. The name of the gene is shown on the right of the gene symbol
5 - Gene, Experiment and Log2 fold change: The fields display the expression value of a gene in one experiment. This information is triggered when the user points the mouse over a certain square in the zoom heat map.
6 - Radar and Zoom: These features controls the size of the miniature and zoom heat maps respectively. To apply the new parameters click on the Change button.
7 - Download expression data: saves data in a .txt file
8 - Search: In the Search for text field the user provides a single gene or list of gene symbols or names separated by enter key. Then the user can select the corresponding field (symbol/name). Clicking on GO (8) triggers the query and the expression data for the found genes are displayed. The heat map allows to determine whether the queried genes present similar or distinct expression patterns.
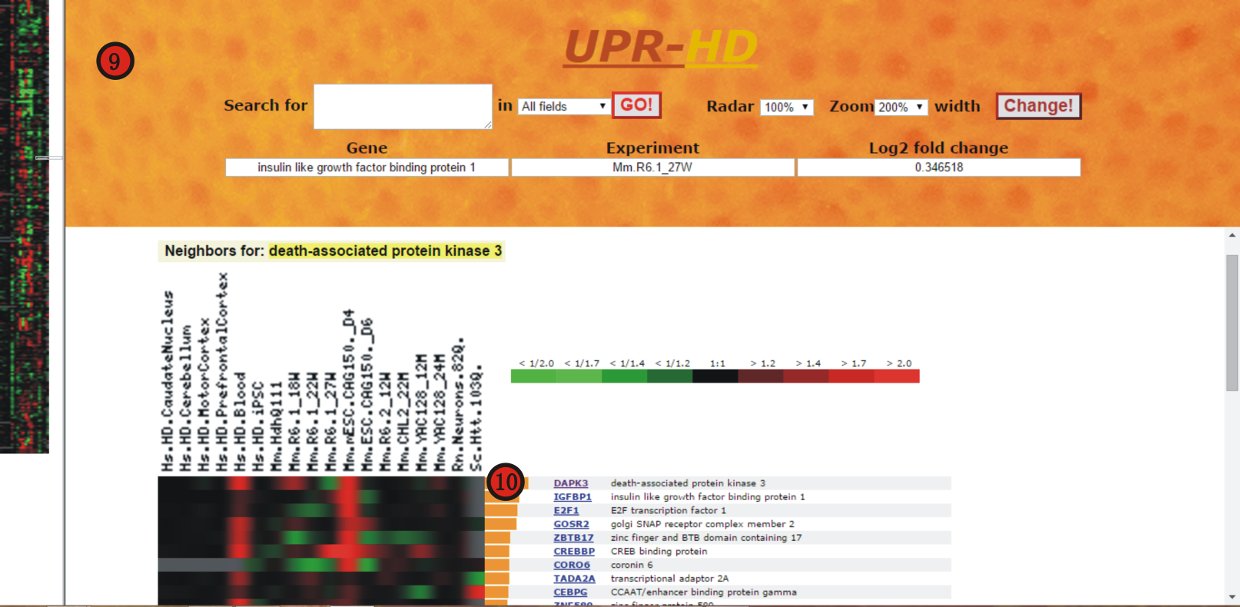
9, 10 - Correlation analysis: When clicking in a row of the heat map, which corresponds to a specific gene, the layout is updated to show other genes with a high correlation coefficient with the selected gene (9). The size of the orange bars in front of a row is proportional to the correlation coefficient of a gene with the selected gene (10). The exact value of the correlation coefficient is shown by pointing the mouse over the orange bar.
Finally, clicking on the UPR-HD logo on top will bring you back to the main page.