Introduction
Huntington's disease (HD) is a fatal neurodegenerative disease, for which no cure has yet been found.
Although the disease-causing mutation in the huntingtin gene has been identfied for over 20 years,
the exact mechanisms that lead to the massive neuronal cell death are still not fully clarified.
A variety of processes such as excitotoxicity, protein aggregation and transcriptional dysregulation
have been linked to neurodegeneration in HD.
More recently, several studies suggested a role of the unfolded protein
response (UPR) in neurodegenerative diseases including HD.
The UPR is a complex process that is activated by the accumulation of un- or misfolded proteins in the
endoplasmic reticulum (ER). As an adaptive response
to counter-balance accumulation of these proteins, the UPR upregulates
transcription of chaperones, temporarily attenuates new translation,
and activates protein degradation via the proteasome. However,
persistent ER stress and an activated UPR can also cause apoptotic cell
death. Although different studies have indicated a role for the UPR in HD,
the evidence remains inconclusive.
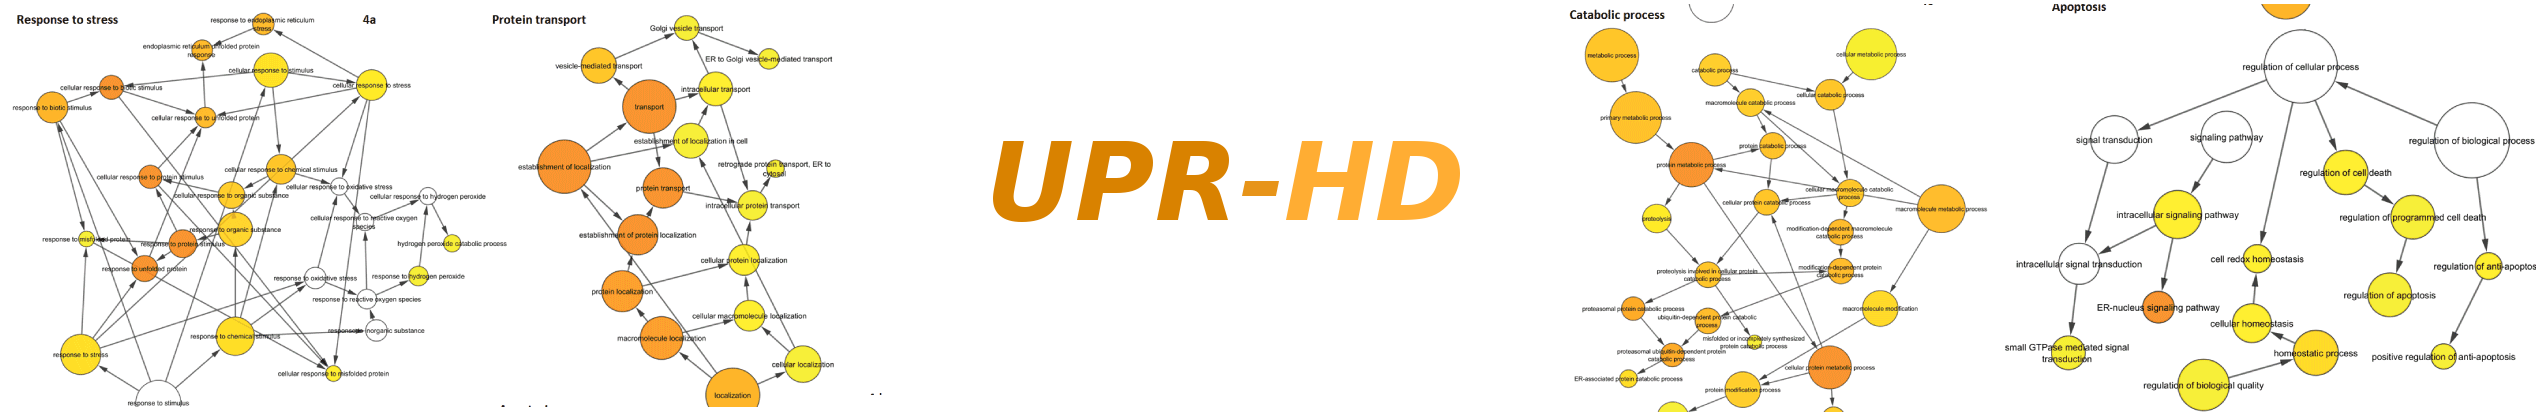
Therefore, we carried out extensive bioinformatic analyses that revealed
wide-spread UPR activation in different experimental HD models based on
publicly available transcriptomic data. The results can be found
in Kalathur et al. 2015.
Here, we present a companion online tool that enables
researchers to search, interactively analyze and visualize the expression patterns of
UPR-associated genes across various HD expression data sets.
Analysis & Visualization
HD-related gene expression data were merged for three distinct sets of genes associated with the UPR were defined based on different evidence: (i) UPR-KEGG-GO with 264 genes, (ii) UPR-Interactions with 270 genes, and (iii) UPR-Literature with 1907 genes. Their exact derivation is detailed in the Data & Samples section.
Clicking on one of the button below leads you to the online tool, where the HD expression data of the selected UPR gene set can be queried, visualised and interactively inspected. Another button links to the online for the integrated UPR gene set. An description how to use the online tool for analysis is presented on the Help page.
UPR-KEGG-GO UPR-Interactions UPR-Literature
UPR-Integrated Gene Sets
The visualisation and analysis tool is based on a modified and enhanced version of GeneXplorer application.
Data & Samples
Derivation of gene sets for UPR
Since the UPR is a complex process, it remains difficult to define a unique set of UPR-associated genes. Thus, three alternative sets of genes associated with the UPR were derived based on different evidence:
- UPR-KEGG-GO includes originally 265 genes that have been associated in Gene Ontology database with ER-associated ubiquitin-dependent protein catabolic process (GO:003043) endoplasmic reticulum unfolded protein response (GO:0030968) or response to endoplasmic reticulum stress (GO:0034976), in KEGG database with Protein processing in ER, or in the REACTOME database with the Unfolded protein response.
- UPR-Interactions includes originally 281 genes and was generated by assembling molecular interactions of UPR components ATF6, ATF4, DDIT3, EIFAK3, ERNI and XBP1 using UniHI and HDNetDB databases.
- UPR-Literature comprises originally 2048 genes that were listed in supplementary materials of published studies of the UPR. These studies were performed in yeast and human cells using high-throughput techniques such as yeast two-hybrid, microarrays and ribosome profiling coupled with next generation sequencing. Additionally, we added genes that were found to be associated with ER-Stress or Unfolded Protein Response by text-mining in the GeneCards database.
Details can be found in Table 1 of the
publication describing our study of the UPR in HD.
HD gene expression data
HD gene expression data were downloaded from the Gene Expression Ominibus database. These data include gene expression from human brain and blood samples, human iPSCs, mouse, rat and yeast HD models, as well as murine cell lines (see Table below). All expression data sets were pre-processed using RMA (Robust Multi-array Average) implemented in R and analysed using the limma Bioconductor package. Additionally, we included RNA-Seq data measuring the expression in Htt heterozygous mice with different CAG repeat length.
For mapping from different organims to human, the HGNC Comparison of Orthology Predictions (HCOP) search tool was employed. Note, that for the analyses presented in the publication all predicted orthologs were included. For visualization of expression across different organisms by the online tool, however, it is preferrable to reduce the non-unique mappings. Thus, if multiple orthologs were found, we have selected only those with the highest number of supporting prediction algorithms. Furthermore, genes are only visualised if more than 50% of their expression values are present.
| GEO ID | Comparison | Organism | Pubmed id |
| GSE3790 | HD caudate nucleus / cerebellum / motor cortex / prefrontal cortex vs control | Human | 16467349 |
| GSE24250 | HD blood vs control | Human | 21044956 |
| GSE37547 | HD iPSC vs corrected iPSC | Human | 22748967 |
| GSE3583 | HdhQ111 striatal cells vs WT | Mouse | 17708681 |
| GSE3621 | R6/1 brain vs WT at 18w, 22w, 27w | Mouse | 17696994 |
| GSE9760 | mESC (CAG150) vs control mESC at 4d, 6d | Mouse | |
| GSE9803 | R6/2 striatum vs WT at 12w | Mouse | 17519223 |
| GSE10202 | CHL2 striatum vs WT at 22m | Mouse | 17519223 |
| GSE18551 | YAC128 striatum vs WT at 12m, 24m | Mouse | 20089533 |
| GSE12481 | Neuronal culture 82Q vs control | Rat | 18815258 |
| GSE18644 | Htt103Q vs Htt25Q | Yeast | 21044956 |
Reference
In case that you are using this resource for your research, please quote following reference:Ravi Kalathur, Joaquin Giner-Lamia, Susana Machado, Tania Barata, Kameshwar Ayasolla and Matthias E. Futschik: The unfolded protein response and its potential role in Huntington's disease elucidated by a systems biology approach. F1000Research 2015, 4:103 ( doi: 10.12688/f1000research.6358.2)