Use of CyanoEXpress
CyanoEXpress is a web database for the exploration and visualization of integrated expression data for Synechocystis sp PCC6803. Its purposes are to assists users in the (i) study of transcriptional responses in Synechocystis to environmental or genetic perturbations, (ii) detection of co-expression and potential co-regulation and (iii) identification of potential functional relations between genes. To utilize CyanoEpress, a gene expression data set has to be selected.
The CyanoEXpress Home page (Fig.1) gives a short overview of CyanoEXpress, its application and usage. In the top frame, links are provided to the other pages: Gene Expression, Sample Information and Help.
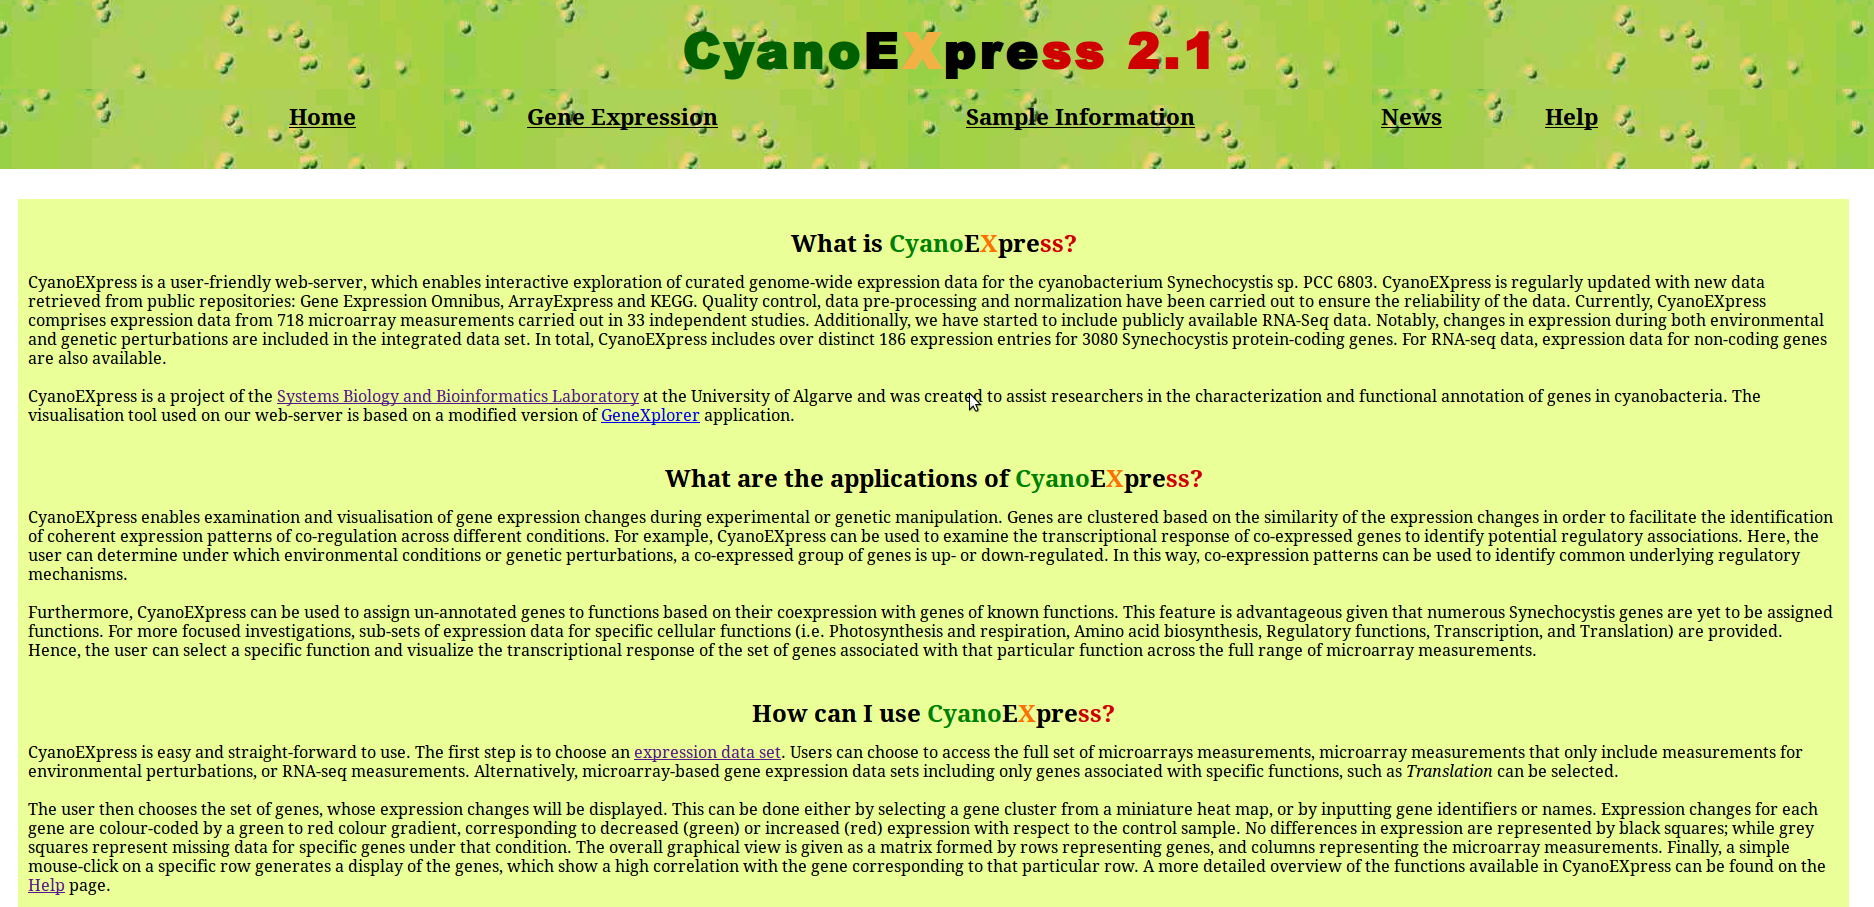
Figure 1: CyanoEXpress homepage
CyanoExpress includes several clustered expression datasets. Links to these datasets are provided on Gene Expression page (Fig. 2). The Gene Expression page is divided in two parts, the upper panel (Expression data sets with full set of Synechocystis genes) contains three thumbnails linked to Microarray: All perturbations containing both genetic and environmental perturbations measured by microarrays and Microarray: Environmental perturbations containing only expression changes due to environmental perturbations measured by microarrays, and RNA-Seq:Environmental perturbations containing expression changes measured by RNA-Seq technology.
The lower half show thumbnail images that direct to clusters of Microarray-based expression data sets with process-specific sets of Synechocystis genes.
These datasets present gene expression is for subsets of genes associated specific function in Cyanobase. Examples are:
• Photosynthesis & Respiration: In this dataset, genes were included, that were associated with photosynthesis or respiration in Cyanobase.
• Amino acid biosynthesis: The dataset includes only gene associated with amino acid biosynthesis
in Cyanobase.
• Regulatory functions: In this dataset, only genes were included which were assigned
to regulatory functions in Cyanobase.
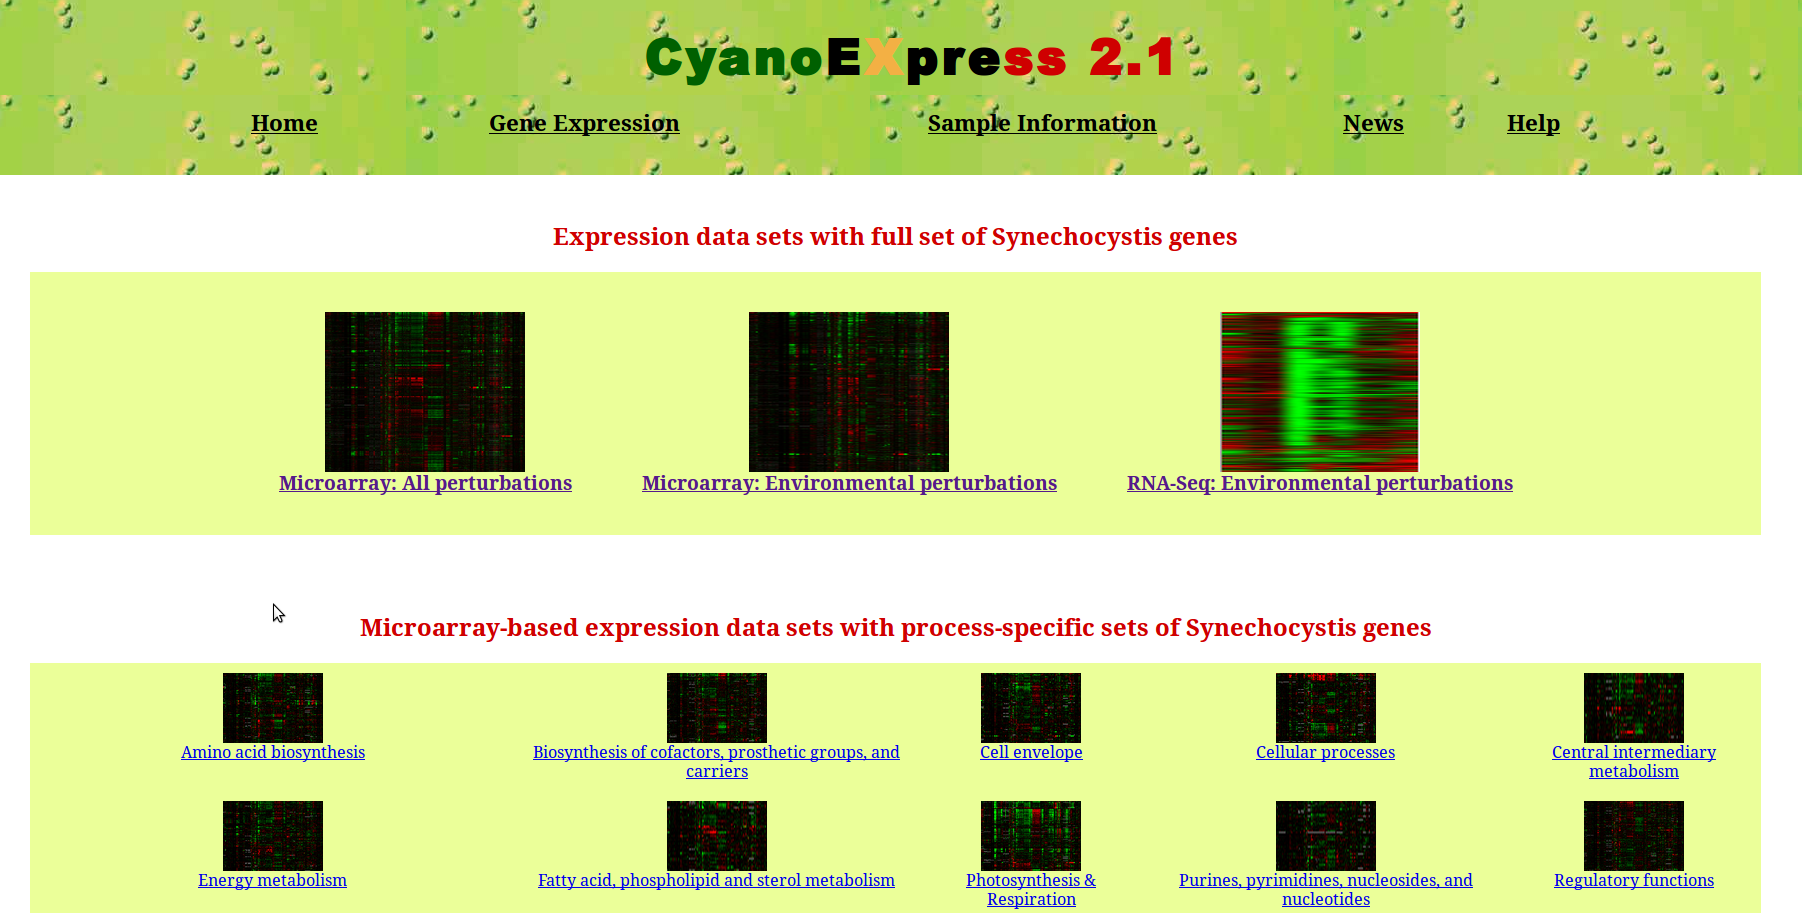
Figure 2: Gene Expression page
After clicking on the corresponding thumbnails picture, selected dataset can be explored using the visualisation tool shown in Fig.3. Here, the user can investigate differential expression of a gene or set of genes across different perturbations as well as the co-expression of genes. In the left frame, a miniature heat map (Radar) is shown. Using the mouse pointer, a range of genes can be selected by clicking and their expression changes will be enlarged in the lower (Zoom) frame.
The drop-down menus for Radar and Zoom control the size of the two heat maps displayed on the webpage.
Radar increases or decreases the miniature heat map in the left frame, while Zoom controls the size of the heat map displayed in the lower frame.
The overall graphical view is provided as a matrix formed by rows representing genes, and columns representing the environmental conditions or genetic perturbations. On the right side of the heat map, the corresponding gene identifiers and names are shown. The identifiers are linked to the Cyanobase .
The expression changes are colour-coded by a green to red colour gradient, corresponding to decreased (green) or increased (red) expression with respect to the control sample. A colour-bar on the right side indicates the range of fold changes. No differences in expression are represented by black squares, while grey squares indicate no available data.
In the top frame of the web-page, several fields are displayed. The text field display gene name, the condition and observed fold change depending on where the mouse pointer is positioned to in the lower Zoom frame.
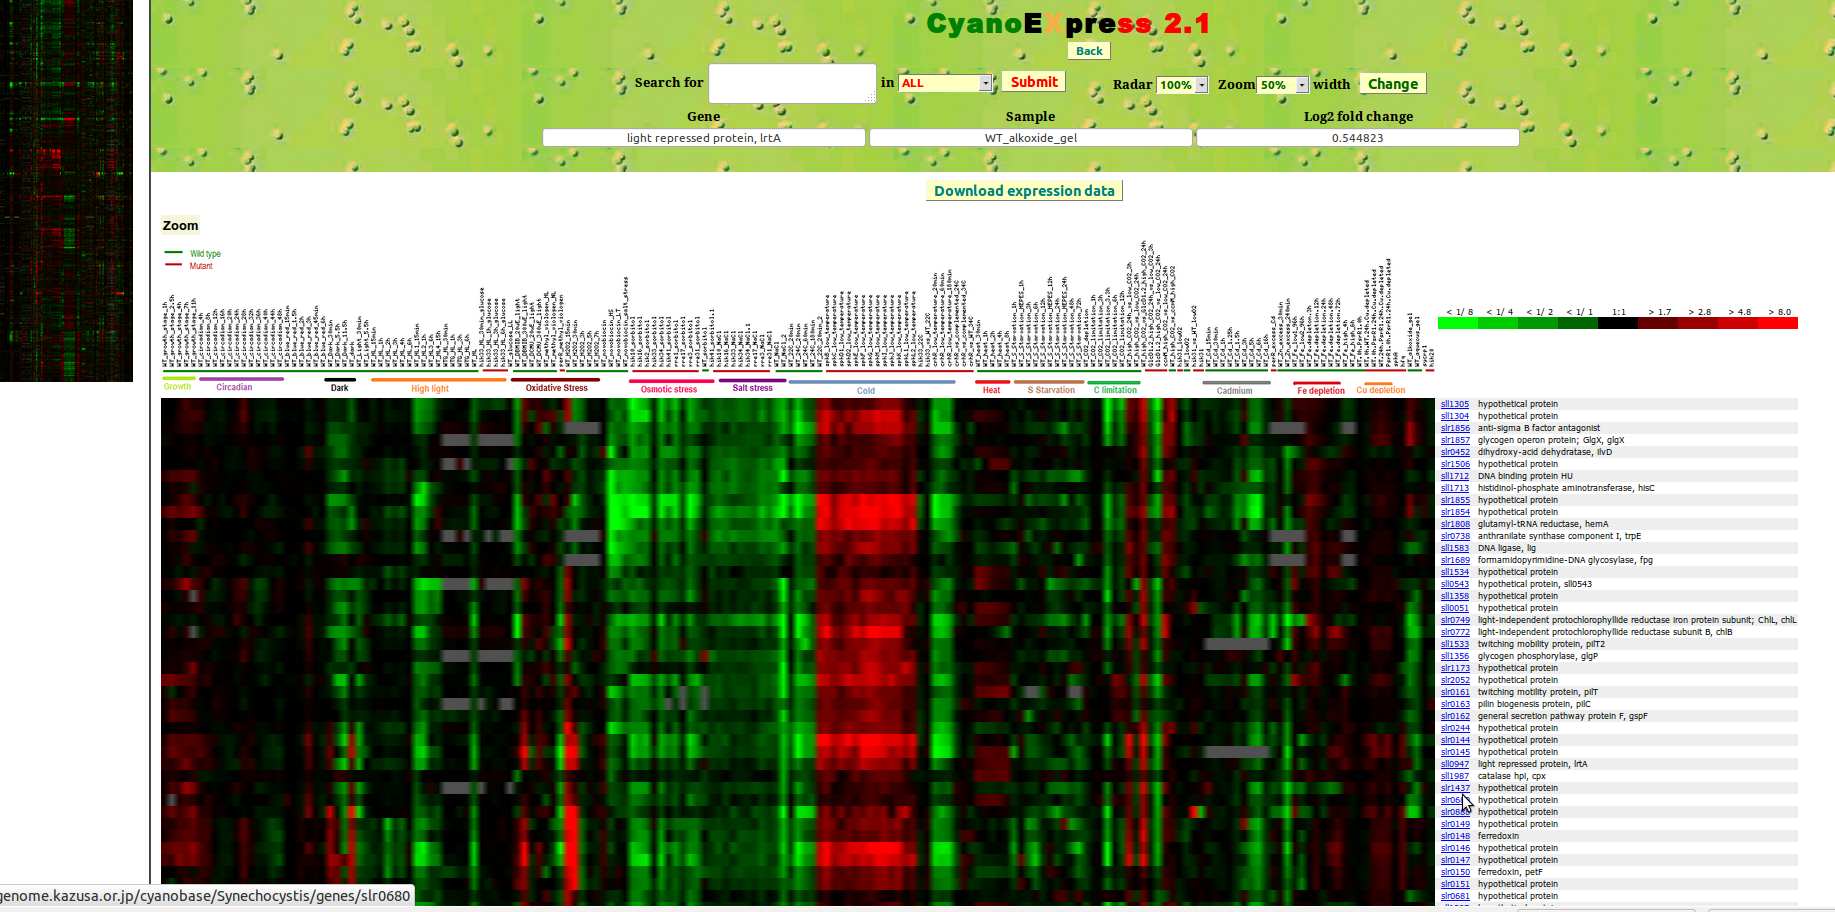
Figure 3: CyanoEXpress Visualization tool
To query expression changes for a specific gene, the user can alternatively input its UNIQID (e.g. ssr2595) or NAME (e.g. high light-inducible polypeptide HliB, CAB/ELIP/HLIP superfamily) in the Search for text field and then press Submit button (Fig. 4).
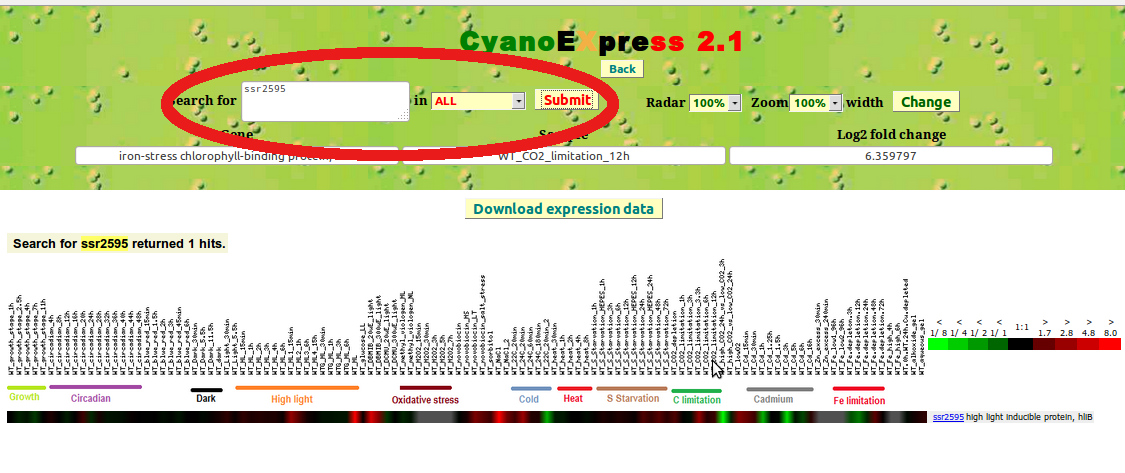
Figure 4: Search by Gene identifier
It is also possible to input two or more genes (identified by up to 500 characters). This enables the direct comparison of expression changes of a defined set of genes, such as genes included in the same operon. For instance, inputting of "sll0247 sll0248 sll0249 ssl0461" shows the expression changes for the operon including isiA and isiB (Fig. 5).
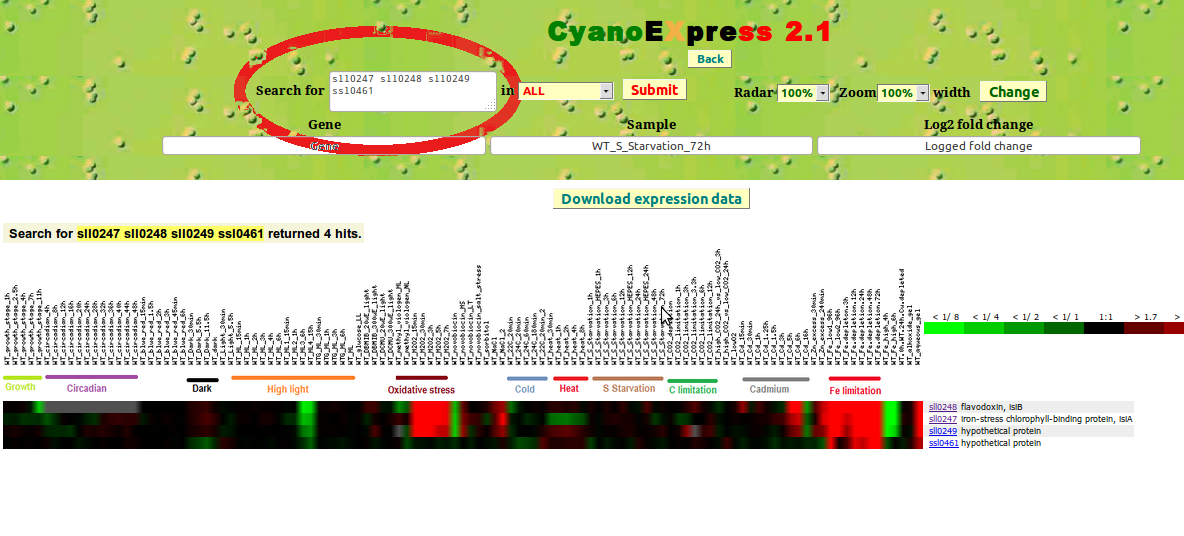
Figure 5: Expression changes for the isiA operon including "sll0247 sll0248 sll0249 ssl0461"
Once the heat map for the expression changes of specific genes is displayed, the user can interactively selected a specific gene by clicking on a corresponding with the fold changes. Subsequently, the expression changes for the top 20 genes with the Pearson correlation coefficient larger 0.3 will be displayed (Fig. 6). Passing the mouse pointer over the orange bars adjacent to the genes identifiers results in the display of the Pearson correlation coefficient as tooltip.
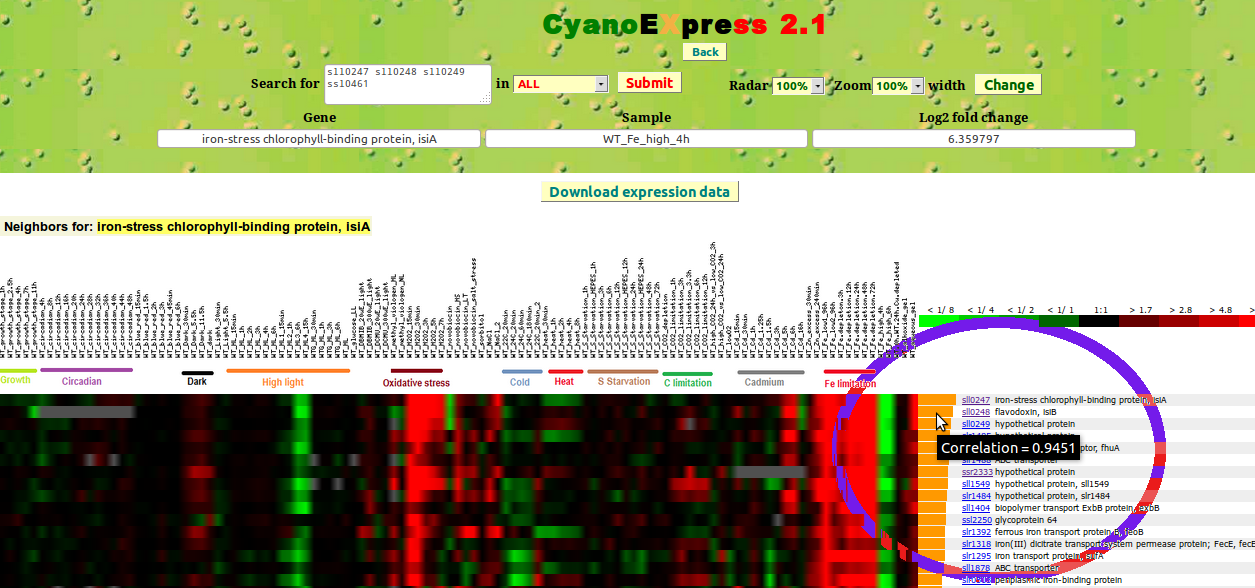
Figure 6: Set of genes with correlated expression changes
Finally, the Back button leads the user to the CyanoEXpress Home page again.
Contacts
For any query or suggestion please contact:Miguel A. Hernandez-Prieto
Email:mpl(at)sysbiolab.eu
Joaquin G. Lamia
Email:Jglamia(at)sysbiolab.eu>
Matthias E. Futschik
Email: matthias.futschik(at)sysbiolab.eu
Systems Biology and Bioinformatics Laboratory
Centre for Marine Science (CCMAR)
University of Algarve
Campus de Gambelas
8500-139 Faro, PORTUGAL